前言
在 MPAndroidChart 中,我们可以直接使用 setBackground() 来为图表设置 drawable 背景,但是这个背景会覆盖图表的全部区域,包括坐标轴和图例。
有时候,我们只想为图表区域绘制背景,不想覆盖坐标轴和图例。MPAndroidChart 提供了方法 setGridBackgroundColor() 可实现类似目的,但是,此方法只支持纯色,不支持通用的 drawable 。
所以,有没有一种方法,能够只在图表区域绘制背景,且支持 drawable 呢?
找了一圈,好像没有现成的解决方案,那就自己研究下吧。
方案
看了一下,MPAndroidChart 中使用了 contentRect 来标识实际图表区域位于整个 chart view 中的位置,因此,我们可以自己实现一个 drawable ,只在目标区域绘制背景,代码如下,以拓展函数的形式实现:
fun Chart<*>.setContentBackground(drawable: Drawable) {
background = object : Drawable() {
override fun draw(canvas: Canvas) {
val paint = Paint()
// In case you want to change the color outside the content.
// paint.setColor(xxx)
canvas.drawRect(bounds, paint)
drawable.bounds = contentRect.toRect()
drawable.draw(canvas)
}
override fun setAlpha(alpha: Int) {
}
override fun setColorFilter(colorFilter: ColorFilter?) {
}
override fun getOpacity(): Int {
return PixelFormat.TRANSLUCENT
}
}
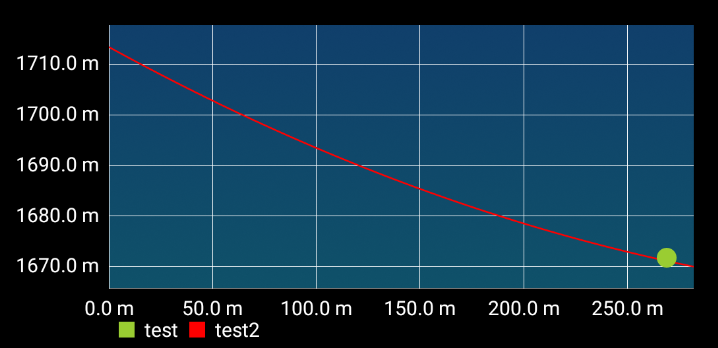
}使用非常简单:
chart.setContentBackground(getDrawable(R.drawable.my_background)!!)效果如图。
同时,注意到 github issue 中也有类似的问题,于是把解决方案也同步了过去。
https://github.com/PhilJay/MPAndroidChart/issues/1048