This artical is translated with ChatGPT. I didn't do much check on the translation. Please tell me if there's any problem.
Preface
Recently, there was a popular concept called FAS (Frame time Aware Scheduling), which regulates the processor frequency based on frame generation time instead of processor load. This operation can minimize the processor frequency as much as possible without affecting the frame rate, thereby improving the energy efficiency of the game. Many smartphone manufacturers have also adopted similar ideas to improve game power consumption, such as Xiaomi's FEAS.
Next, I want to clarify some concepts that will be used later. First, "frame time" and "frame generation time" are two different concepts. "Frame time" refers to the interval between two consecutive changes in the displayed content, while "frame generation time" refers to the time spent generating this frame.
Taking the simplified frame rendering-display process (1) in the image below as an example:
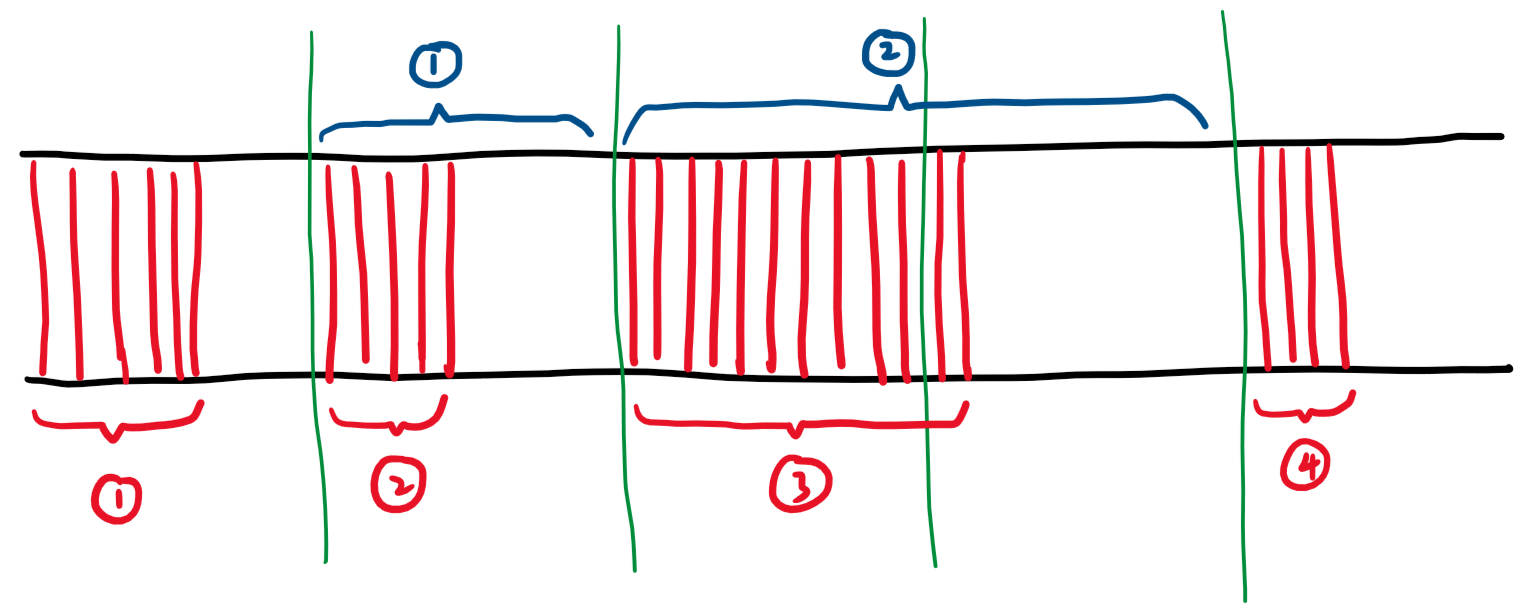
In the above picture, the horizontal axis represents the timeline, and the green vertical line represents the vsync signal at that moment. The red part represents the new frame being generated. The red number indicates that the nth frame is being generated, and the blue number indicates that the nth frame is being displayed on the screen. When the vsync signal arrives, the previously generated frame will be displayed on the screen, and the generation of a new frame will also begin.
Let us explain the image in detail:
- First, the first frame begins to be generated, and the generation of this frame is quickly completed, but it must wait until the vsync signal arrives before it can be displayed on the screen, so it waits for a while out of thin air.
- When the vsync signal arrives, the first frame is displayed on the screen, and the generation of the second frame begins. The generation of the second frame is also quickly completed, but it must continue to wait for the next vsync signal.
- When the vsync signal arrives, the second frame is displayed on the screen, and the generation of the third frame begins. The generation of the third frame seems a bit slow.
- When the vsync signal arrives, but the third frame has not yet been generated, so the content displayed on the screen has not changed, and the second frame continues to be displayed on the screen. At this time, we can say that the frame has been dropped.
- When the vsync signal arrives again, the third frame has already been generated, so it is displayed on the screen, and the generation of the fourth frame begins.
Through the above explanations, I think you should be able to better distinguish "frame time" and "frame generation time". In the image above, the part enclosed in blue brackets is the "frame time" of the nth frame, and the part enclosed in red brackets is the "frame generation time" of the nth frame.
As you can see, "Frame Generation Time" can directly reflect the current performance. If the "Frame Generation Time" of a specific frame exceeds the vsync interval (i.e. screen refresh interval), dropped frames will inevitably occur.
When dropped frames have started to occur, "Frame Time" can also reflect performance to some extent.
For FAS mentioned earlier, the best practice is to make the "Frame Generation Time" approach (less than or equal to) the "Screen Refresh Interval" from the left as much as possible. However, in reality, obtaining data for "Frame Generation Time" can be quite challenging as it requires accessing the application process, given that the rendering process mainly occurs within the corresponding application process. "Frame Time," on the other hand, can be obtained directly from SurfaceFlinger, which is relatively more convenient.
Therefore, common FAS implementation, such as the Scene FAS, uses "Frame Time" to replace "Frame Generation Time," for example, by controlling the processor frequency to stabilize the "Frame Time" as much as possible. This method can work well for gaming applications because the frame rate of the game screen tends to be stable and continuous. However, for daily applications, this method may fail. In daily applications, we may encounter many situations where the screen is completely still, such as when reading. In this case, there is no screen refreshment, and the "Frame Time" will become very large. However, this cannot indicate that dropped frames are occurring due to insufficient performance because there are no new frames in this case, rather than dropped frames due to insufficient performance. This defect of "Frame Time" makes it difficult to apply FAS to daily applications.
This article's content will help solve this dilemma but can only solve the "Frame Generation Time" acquisition problem for ordinary Android applications based on libhwui. For gaming applications using their rendering engine, using "Frame Time" instead of "Frame Generation Time" remains the best compromise solution at present.
Notes:
- (1) Yes, it simplifies many things, but it's entirely valid in helping to understand the concept. In reality, due to the GPU's asynchrony, there is also the problem of triple buffering. Furthermore, the timing of the vsync-sf and vsync-app signals is not synchronous, and the occurrence time of these signals may not even be fixed, see (3) for details.
- (2) I once thought of using the interval between distributing vsync signals to the application 'queuebuffer()' in SurfaceFlinger as "Frame Generation Time," but failed because it is unfriendly to operate in the kernel and requires a lot of reverse engineering and register-level programming. However, for third-party ROM, this may be a feasible idea. However, as the application may not update the frame after receiving the vsync signal, it would still be challenging to determine which vsync signal this 'queuebuffer()' belongs to.
- (3) The vsync signals used by SurfaceFlinger itself (vsync-sf) and those distributed to applications (vsync-app) do not directly come from hwcomposer. SurfaceFlinger itself maintains a software-based vsync generator, and the hardware vsync signal sent by hwcomposer is used to calibrate this "software generator." The hardware vsync signal may even be disabled when unnecessary. This means that the software-generated vsync signal may not be regular and continuous, and there may be a phase difference between vsync-sf and vsync-app signals. Taking the vsync-sf signal as an example, my understanding is as follows (may not be accurate): Only when the application submits a Graphic Buffer, will SurfaceFlinger schedule the next vsync-sf to refresh the screen; if there is no Graphic Buffer submitted by the application, there will be no next vsync-sf signal, and the screen will not refresh.
Starting from uprobe:
The Linux kernel provides a mechanism called uprobe, which replaces the instruction at a specified address in the application's memory page with a "breakpoint exception instruction", causing the application to enter kernel mode and execute callback code at a specified time.
The process can be summarized as follows:
- Replace the instruction at the specified address with a "breakpoint exception instruction".
- When the application executes to that instruction, it enters kernel mode.
- In kernel mode, query the registered uprobes and their handlers, and execute the specified callbacks.
- Single-step the instruction that was replaced before.
- Restore the application to continue normal execution after the breakpoint instruction.
When entering kernel mode, the register information when the application was in user mode is saved. In the uprobe callback function, we can access this information, and even modify it.
The typical use of uprobe is based on tracefs, such as the official usage guide. However, it is not very helpful for kernel-side development. There is also relatively little information available online about using uprobe APIs for kernel development.
The above information is based on the 4.19 kernel.
Next, let's take a small example to see how this offset should be calculated.
#include <stdio.h>

void hello()
{
    printf("Hello\n");
}

int main(int argc, char *argv[])
{
    int i = 10;
    while (i--) {
        hello();
    }
    return 0;
}
This is a very simple code that will call hello() ten times.
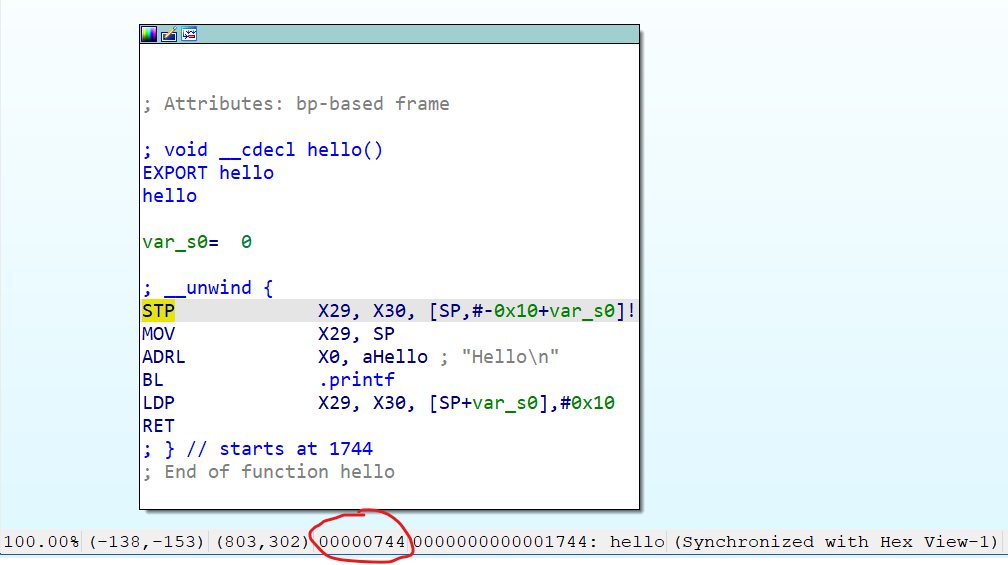
After compilation (1), we can use the readelf -s command to print the address of the hello function in the virtual address space:
$ readelf -s obj/local/arm64-v8a/up-test | grep hello
    46: 0000000000001744    28 FUNC    GLOBAL DEFAULT   14 hello
We can see that its address is 0x1744.
Next, we use readelf -S to find the virtual memory address of the .text section where hello is located:
$ readelf -S obj/local/arm64-v8a/up-test | grep .text
  [14] .text             PROGBITS         00000000000016ac  000006ac
Here, 0x16ac is the virtual memory address of the .text segment. And 0x6ac is the offset of the .text segment in the file.
Now, suppose we want to create a uprobe to monitor the call to "hello" function. Let's set a breakpoint at the entry of the "hello" function. We need to calculate the offset of the entry instruction of the "hello" function in the file.
What we know is: the virtual address of the "hello" function, the virtual address of the .text segment in which the "hello" function is located, and the offset of the .text segment in the file.
So, it is a simple math problem.
Offset of hello in file = virtual address of hello - virtual address of .text segment + offset of .text segment in file
0x1744 - 0x16ac + 0x6ac = 0x744
0x744 is the offset in the file that we need to use to register the uprobe.
Of course, there is also an easier way. Reverse engineering tools like IDA can directly display the offset of symbols in the file:
By the way, the callback function has a return value. If you don't want to perform any fancy operations (like removing the uprobe when it is triggered, etc.), return 0.
Note:
- (1) For this type of code, the compiler can easily optimize the function inline, so remember to add -O0. Also, if the code is compiled using the Android NDK, it will automatically strip the symbol table, resulting in a blank output of "readelf -s". The solution is to use the intermediate products generated under "obj/", rather than the final products under "libs/".
Frame Generation Time Data Source
This is a quite tricky point. As I mentioned before, surfaceflinger could be a starting point, but it is extremely difficult to differentiate between different applications and determine which queuebuffer() corresponds to which vsync. Moreover, the compiled surfaceflinger does not carry debug symbols, and it is written in C++, making reverse engineering almost like depending on a miracle: even if we locate the target method this time, it may end up in failure next time or when changed to another person or device.
Suddenly, I remembered a mysterious thing called "GPU Profiling" in Android Performance documentation:
What is the data source of this chart, and who drew the chart? If the data comes from a system service, how does it collect the data? If the data comes from the application itself, how does it send the data to the system service to draw the chart?
After a quick look at the code, I realized that I had not guessed any of it correctly. The reality is: the application itself collects the data and draws the chart after drawing the interface actively. There is no IPC involved in the process from data collection to chart drawing.
Then, why can I control a bunch of applications to start drawing the chart with just one switch? Isn't that strange?
Behind this, the switch controlling "GPU rendering profile" is the debug.hwui.profile prop. When the value of this prop is set to visual_bars, each application will start actively drawing graphs.
But why do all these applications uniformly monitor this prop, collect data autonomously, and draw graphs in a unified style? Did the application developers coordinate beforehand?
No coordination was necessary. Most Android applications are developed based on components provided by the platform API (such as View), and the hardware-accelerated rendering process of these components will call the system's built-in libhwui library. The well-known skiavk and skiagl are part of the rendering pipeline in libhwui. In fact, the process of listening to the prop and drawing graphs is implemented in libhwui itself, and the data collection process is completed by "time sampling points" that are pre-embedded in the platform API. So to answer the previous question simply: although everyone's applications will actively collect data and draw graphs together, this is not because everyone has written code to collect data and draw graphs, but because the platform API they use already includes these features.
However, not all applications have this kind of tacit agreement. For example, browser and game applications often have their own rendering engines and do not use the rendering pipeline provided by libhwui. For these applications, we cannot use this method to obtain "frame generation time".
Thus, we can conclude that most applications actually silently collect rendering-related performance data, which was originally intended for "GPU rendering profile" analysis, but now it is time for these data to serve us.
Data Collection Process
Next, let's discuss how the data collection is carried out using the platform API.
Before that, we need to understand how the application responds to external stimuli.
The response process mainly involves two threads, one is the well-known UI thread, and the other is the rendering thread (RenderThread), which is relatively transparent to the application developers.
SurfaceFlinger sends a vsync-app signal to the application, which then performs the following tasks:
- (UI thread) Handles input events (such as screen scrolling) (and changes associated components involved in the next step to respond accordingly).
- (UI thread) Traverses the View tree, calls the relevant component's
draw(), and records the resulting drawing calls (such as "draw a circle at (0,0)"). - (UI thread) Records drawing calls required for ongoing animations.
- (UI thread) ......
- (UI thread) Submits recorded drawing calls to the rendering thread.
- (Rendering thread) Organizes and optimizes drawing calls.
- (Rendering thread) Submits drawing calls to the GPU.
- (Rendering thread) Submits the Graphic Buffer to SurfaceFlinger(1).
It should be noted that the entire process mentioned above has already been included in the platform API, and what application developers typically need to develop are simply some callbacks involved in this process, such as onTouchEvent() and onDraw().
Generally speaking, the UI thread is responsible for generating drawing calls, and the rendering thread is responsible for submitting them to the GPU.
The entire process mentioned above needs to be completed within one frame (or even shorter), otherwise it will result in frame skipping and lag.
As we often say, we should not perform time-consuming operations on the UI thread because, as seen from the above process, performing time-consuming operations on the UI thread will delay the generation of drawing calls, thereby making it difficult for the entire process to complete in one frame's time.
As we all know, a typical Android app can consist of both Java and Native parts, and the platform API is also the same. We can divide the above process into Java and Native parts as follows:
- (Java layer) Handle input events (such as screen scrolls) (in addition to causing changes in the components involved in the next step, so it responds).
- (Java layer) Traverse the View tree, call the relevant component's
draw(), and record the resulting drawing calls (such as "draw a circle at (0,0)"). - (Java layer) Record the drawing calls required for ongoing animations.
- (Java layer) ...
- (Native layer) Submit the recorded drawing calls to the rendering thread.
- (Native layer) Organize and optimize drawing calls.
- (Native layer) Submit drawing calls to the GPU.
- (Native layer) Submit the graphic buffer to SurfaceFlinger(1).
Generally speaking, the Java layer is used to provide convenient development interfaces for app developers, while the Native layer is the main arena for the rendering engine, with libhwui mainly responsible for this part of the Native layer.
Moving on to the main topic, now that we have understood the overall process of an app from receiving a vsync signal to producing a frame, Android has embedded many "time sampling points" in the platform API in order to track the performance of this entire process. Let's take the Java layer as an example:
frameworks/base/core/java/android/view/Choreographer.java
void doFrame(long frameTimeNanos, int frame,
        DisplayEventReceiver.VsyncEventData vsyncEventData) {
    ......
        ......
            ......
            mFrameInfo.setVsync(intendedFrameTimeNanos, frameTimeNanos,
                    vsyncEventData.preferredFrameTimeline().vsyncId,
                    vsyncEventData.preferredFrameTimeline().deadline, startNanos,
                    vsyncEventData.frameInterval);
            ......
        ......

        mFrameInfo.markInputHandlingStart();
        ......

        mFrameInfo.markAnimationsStart();
        ......

        mFrameInfo.markPerformTraversalsStart();
        ......
    ......
}
These "time sampling points" will record the time when the vsync signal starts and the time when key and time-consuming processes occur, providing a basis for performance tracking.
Similarly, the libhwui rendering library in the native layer also has similar sampling points. Here I will only show the sampling method in the header file:
frameworks/base/libs/hwui/FrameInfo.h
void markSyncStart() { set(FrameInfoIndex::SyncStart) = systemTime(SYSTEM_TIME_MONOTONIC); }

void markIssueDrawCommandsStart() {
    set(FrameInfoIndex::IssueDrawCommandsStart) = systemTime(SYSTEM_TIME_MONOTONIC);
}

void markSwapBuffers() { set(FrameInfoIndex::SwapBuffers) = systemTime(SYSTEM_TIME_MONOTONIC); }

void markSwapBuffersCompleted() {
    set(FrameInfoIndex::SwapBuffersCompleted) = systemTime(SYSTEM_TIME_MONOTONIC);
}

void markFrameCompleted() { set(FrameInfoIndex::FrameCompleted) = systemTime(SYSTEM_TIME_MONOTONIC); }
These methods will be called at critical positions in the rendering pipeline, recording the corresponding timing and providing a basis for subsequent performance tracking.
Note:
- (1) At this point, the GPU rendering may not be completed yet, and it involves fence, which is very complicated, so it will not be elaborated here.
- (2) Completion does not necessarily mean generating a frame or submitting to SurfaceFlinger, for example, when your application is a static interface. Here, it is emphasized that if it is not completed in time, there will definitely be frame skipping.
Data Utilization
Next, we should study how to utilize the data that originally belonged to "GPU Render Mode Analysis". We already know that the logic of drawing the mysterious analysis chart is done in the rendering pipeline of the native layer libhwui, while the data collection process occurs simultaneously in the Java layer and the native layer. Are there any weaknesses in this process? Or, are there any places suitable for inserting breakpoint instructions with uprobe?
In the Java layer, obviously there isn't, as it involves virtual machines and JIT, which are difficult to work with during the defense.
In pure native layer, it seems that there isn't one either, as it doesn't even retain symbol tables and finding a function is a challenge.
However, the data collected in the Java layer still needs to be passed to the native layer, right? After all, using this data to draw a chart can occur in the native layer.
Hey, isn't this transfer process always fixed? After all, JNI calls require fixed symbols.
This is a relatively simple starting point.
First, let's take a look at how data is passed from the Java layer to the native layer:
frameworks/base/graphics/java/android/graphics/HardwareRenderer.java
/**
 * Syncs the RenderNode tree to the render thread and requests a frame to be drawn.
 *
 * @hide
 */
@SyncAndDrawResult
public int syncAndDrawFrame(@NonNull FrameInfo frameInfo) {
    return nSyncAndDrawFrame(mNativeProxy, frameInfo.frameInfo, frameInfo.frameInfo.length);
}
This method involves putting the data collected just now into the native layer channel. Here, frameInfo.frameInfo is an array, and the different indexes of the array represent different data (such as start time of different stages). For the specific definition, please refer to FrameInfo.java.
The method calls nSyncAndDrawFrame(), which is a native method, but it is not exported as a symbol, and instead uses dynamic registration.
frameworks/base/libs/hwui/jni/android_graphics_HardwareRenderer.cpp
static const JNINativeMethod gMethods[] = {
        ......
        {"nSyncAndDrawFrame", "(J[JI)I", (void*)android_view_ThreadedRenderer_syncAndDrawFrame},
        ......
};
......
int register_android_view_ThreadedRenderer(JNIEnv* env) {
    ......
    return RegisterMethodsOrDie(env, kClassPathName, gMethods, NELEM(gMethods));
}
The actual native method it is bound to is android_view_ThreadedRenderer_syncAndDrawFrame. Let's take a look at it:
frameworks/base/libs/hwui/jni/android_graphics_HardwareRenderer.cpp
static int android_view_ThreadedRenderer_syncAndDrawFrame(JNIEnv* env, jobject clazz,
                                                          jlong proxyPtr, jlongArray frameInfo,
                                                          jint frameInfoSize) {
    LOG_ALWAYS_FATAL_IF(frameInfoSize != UI_THREAD_FRAME_INFO_SIZE,
                        "Mismatched size expectations, given %d expected %zu", frameInfoSize,
                        UI_THREAD_FRAME_INFO_SIZE);
    RenderProxy* proxy = reinterpret_cast<RenderProxy*>(proxyPtr);
    env->GetLongArrayRegion(frameInfo, 0, frameInfoSize, proxy->frameInfo());
    return proxy->syncAndDrawFrame();
}
The array passed in from the Java layer becomes a handle in the native layer, and we need to use the corresponding method in the virtual machine to obtain the elements of the array, for example, env->GetLongArrayRegion() copies all the array elements to proxy->frameInfo().
At this point, we can see that android_view_ThreadedRenderer_syncAndDrawFrame is a method that is very suitable for inserting uprobe breakpoints. Although this method is not exported as a symbol, nSyncAndDrawFrame used when registering the method is a constant, so it should not be difficult to find the address of this method.
Looking at the content of this method, after calling env->GetLongArrayRegion(), doesn't proxy->frameInfo() store the frame data we want?
This method is easy to find, short, and convenient to obtain the target address. It's hard to find a more perfect uprobe object.
Breakpoint Selection
Next, pick up the reverse engineering tool and open /system/lib64/libhwui.so to determine the offset used for uprobe!
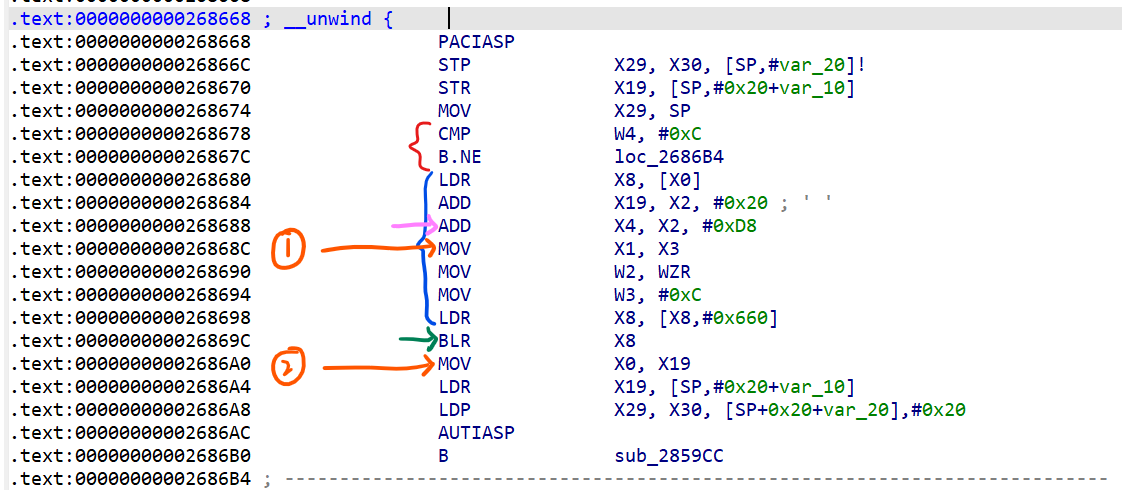
Taking IDA as an example here, we can directly search for the key nSyncAndDrawFrame and find where it is used (note that it is not where it is defined):

Here, we see the gMethods registration table that we saw earlier, and the highlighted area is the pointer to the target android_view_ThreadedRenderer_syncAndDrawFrame (IDA gave it an additional name).
Double-click it, and we can jump to where android_view_ThreadedRenderer_syncAndDrawFrame begins:
(If your diagram is in flowchart form, you can switch to this code form by pressing space)
Next, we map the assembly code to the original code above and organize the process of this function.
First is the red parentheses, which correspond to LOG_ALWAYS_FATAL_IF(), which performs a comparison and jump execution, which we don't need to worry about.
The blue parentheses that follow are the key part, responsible for preparing parameters for GetLongArrayRegion().
The instruction pointed to by the green arrow is where we jump to execute GetLongArrayRegion().
The orange part will be explained below.
Next, let's briefly introduce the fastcall function calling convention: it stipulates that when calling a function, registers rather than the stack are used to pass parameters (unless there are too many parameters).
The function call used here is fastcall. On ARM64, integer parameters are stuffed into X registers. For example, the this pointer is stuffed into X0, the first parameter is stuffed into X1, the second parameter is stuffed into X2, and so on (assuming that the number of parameters is not too much).
As we can see, the target address used to store frame data proxy->frameInfo() is the fourth parameter, so when preparing the parameters, our most desired target address will be placed in the X4 register.
The instruction pointed to by the pink arrow stuffs the target address into the X4 register.
So, after the instruction pointed to by the green arrow is executed, can we obtain the first element of the frame data by taking the value stored in the X4 register?
No, because executing the instruction pointed to by the green arrow will jump to execute another function, in which the value of the X4 register may have already been overwritten.
This means that we need two uprobe breakpoints in order to read the frame data.
The first breakpoint should be placed after the X4 register is assigned, i.e., at the location of the orange arrow labeled 1. We will use the uprobe here to save the value of the X4 register to obtain the address where the frame data is stored.
The second breakpoint should be placed after the "jump to execute" instruction, i.e., at the location of the orange arrow labeled 2. At this point, the frame data has just been saved to the corresponding address, and we need to use the uprobe to retrieve the frame data. Therefore, once we have the generation time of the frame, we can perform any operation we want.
You may ask, why "after" rather than just on that instruction? This can be revisited by reading the uprobe's timeline above.
Built Wheel
https://github.com/libxzr/kernel-playground/commits/playground/hwui_mon
I have created a built wheel from the logic related to calculating frame time from uprobe, based on the 4.19 kernel.
All you need to do is fill in the required breakpoint position and target register number in the following table:
static struct {
    ......
} hwui_info[] = {
// Here, record info to support different versions of libhwui.so.
#define INFO_COUNT 1
    {
        .checksum = "dea5f6def7787d5c89fe66e7f888455953fd8880",
        .inject1_offset = 0x26868C,
        .reg = 4,
        .inject2_offset = 0x2686A0
    }
};
checksum represents the sha1 value of this libhwui.so. The breakpoint position may vary across different device models and operating system versions.inject1_offset represents the file offset of the instruction pointed by the orange arrow labeled as "1" above.reg represents the register number used to store the target address.inject2_offset represents the file offset of the instruction pointed by the orange arrow labeled as "2" above.
You can add different information for different system versions as you wish, just remember to change the INFO_COUNT accordingly. This information will be automatically matched based on the current sha1 value of libhwui.so.
Next, let me talk about how to use it. The above link already provides a demo:
#include <linux/hwui_mon.h>
#include <linux/module.h>

static void handler(unsigned int ui_frame_time)
{
    pr_info("Detect jank in %s with frametime = %d",
            current->comm, ui_frame_time);
}

static struct hwui_mon_receiver receiver = {
    .jank_frame_time = 4000,
    .jank_callback = handler
};

static int __init demo_init(void)
{
    return register_hwui_mon(&receiver);
}

module_init(demo_init);
When registering, you need to specify the "jank time" jank_frame_time. jank_callback is only called when the "frame generation time" is greater than or equal to the "jank time".
Note that jank_callback runs on the UI thread of the application, so do not perform time-consuming operations in it, and offload them to kthreads or workqueues if necessary.
In addition, since it runs in the application process, you can use current->comm to print the (partial) package name of the current application, which may be helpful for application-specific processing.
Frame generation time?
You may have already noticed that our "frame generation time" data source comes from the data passed from the Java layer to the native layer in the application process. This means that the so-called "frame generation time" we obtain is only the time consumed on the Java layer of the application, which is not complete.
Indeed, the time spent by the native rendering engine and GPU rendering time has to be added on top of our "frame generation time" to be considered as the true "frame generation time".
However, all applications use the same libhwui library and run almost the same native rendering engine code. As long as the drawing calls are not too complicated, the native rendering engine and GPU rendering time are almost the same for everyone.
Indeed, the main cause of stuttering is the garbage code on the Java layer, and this aspect of "frame generation time" can accurately reflect the performance requirements of the application.
But anyway, we are just finding excuses. If we could easily obtain the complete "frame generation time," who would use this method (laughs)?
Although it is a compromise, the effect is still good.
Therefore, you must remember that when choosing "jank_frame_time," you must leave enough margin for the rendering engine and GPU. For example, for 120Hz, choose a smaller value like 4000us, instead of being stuck at 8333us. Even if there is a dropped frame, it may not be detected.
Afterword
This is a relatively systematic explanation of the principles and design ideas for extracting frame generation time on the kernel side. I hope you can reproduce the above operation on your own device (●'◡'●).
Additionally, this approach for obtaining "frame generation time" can also theoretically be implemented through zygisk; only communication between the application process and the frame time consumer needs to be solved (using logcat directly can also work xD).
↑ If someone makes it one day, remember to credit me 👀
A zygisk approach by @shadow3
References
https://wizzie.top/Blog/2021/04/14/2021/210414_android_VsyncStudy/
https://www.cnblogs.com/roger-yu/p/16167404.html
https://www.androidperformance.com/2019/12/01/Android-Systrace-Vsync
https://medium.com/@workingkills/understanding-the-renderthread-4dc17bcaf979
https://docs.kernel.org/trace/uprobetracer.html
https://jayce.github.io/public/posts/trace/user-space-probes/
https://gist.github.com/fntlnz/96a6d7bdd9881420c28e6454b8f7b91e